Testing an electronically controlled variable displacement compressor
By Richard Hawkins, MACS contributor
Last week’s article focused on a test observing the behavior of an electronically controlled variable displacement compressor when the A/C system heat loads were changed. The test was recorded to videotape, and some clinic slides were produced from the video. The test was done utilizing the following equipment:
- A R/R/R machine to monitor high and low side pressure.
- An aftermarket “Electrical Control System Compressor System Scanner” to monitor the PWM duty cycle signal being supplied to the compressor control valve.
- A voltmeter to illustrate the correlation between the PWM duty cycle signal and voltage readings taken from the circuit supplying the PWM duty cycle signal to the control valve.
The A/C system was run with the vehicle’s computer controlling the compressor. When the heat loads were changed, there were noticeable changes in the duty cycle signal being supplied to the compressor. The voltmeter which was connected to that same circuit also reflected these changes and illustrated the correlation between the duty cycle and voltage readings. Significant heat load changes resulted in noticeable changes in the high side pressure, but the low side changed very little. (If you haven’t already read last week’s article, you might want to read it before proceeding.)
This week we will be using the same equipment, but information from another video which takes a slightly different approach. Instead of the vehicle’s computer controlling the compressor, we will be manually controlling it with the “Electrical Control System Compressor System Scanner ” and observing the changes. The “Electrical Control System Compressor System Scanner “will be referred to as just the scanner. We start off with a 0% duty cycle and 0 voltage. Please see pictures #1 and #2.
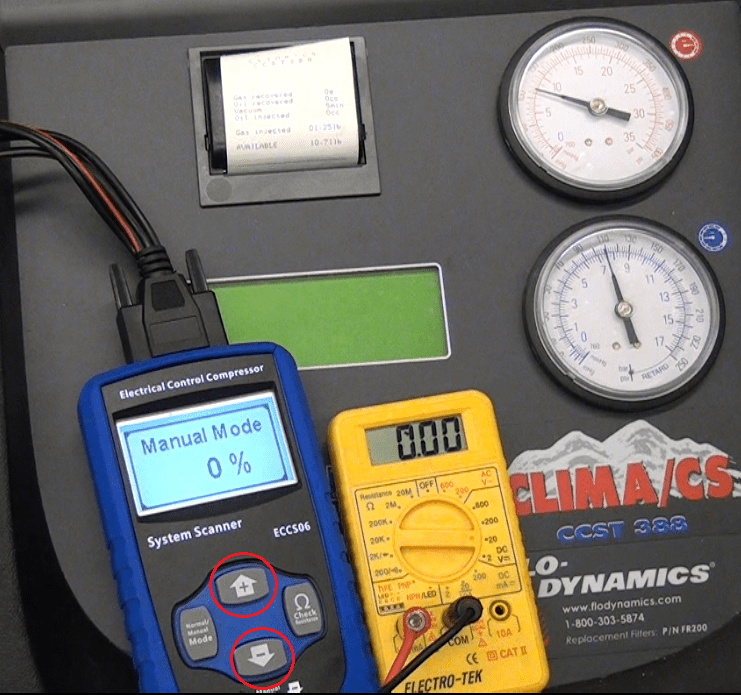
Picture #1: Our equipment set-up. The “Electrical Control System Compressor System Scanner” is connected to the compressor control valve with electrical adapters supplied with the unit. The voltmeter is connected to that same circuit. The + and – buttons (circled in red) are used to control the duty cycle.
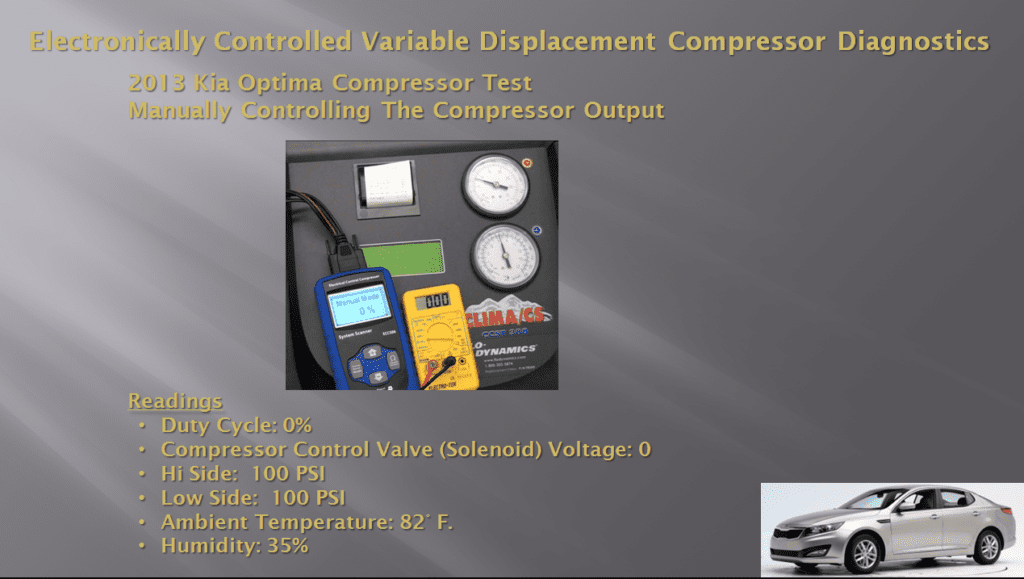
Picture #2: Readings before the “Electrical Control System Compressor System Scanner” is activated.
The next step was to activate the scanner by pushing the + button one time. This yielded a duty cycle of 18.0% and a voltage reading of 2.10 volts. There was no gauge movement. Please see picture # 3.
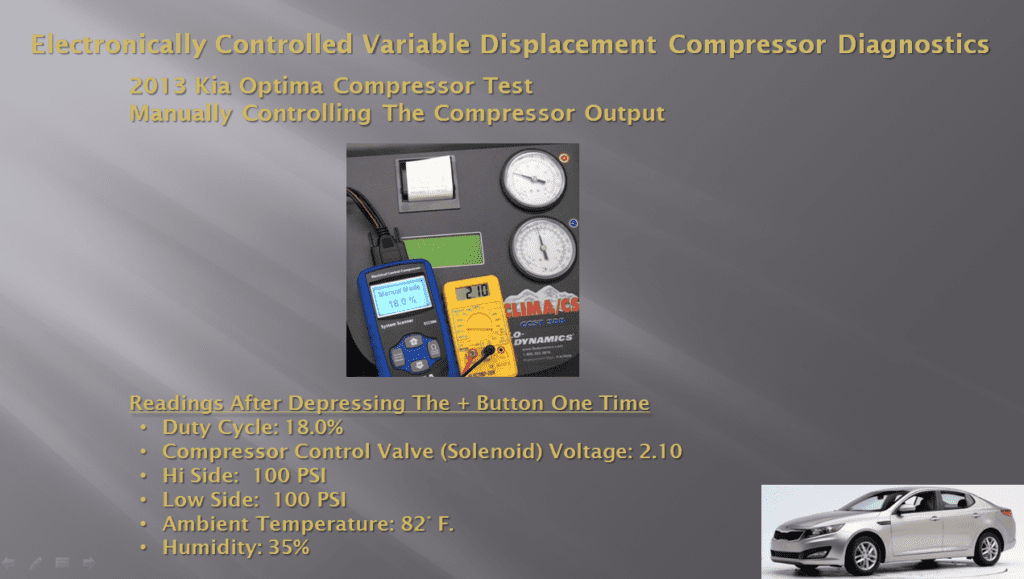
Picture #3: With a duty cycle of 18.0% there wasn’t enough compressor pumping taking place to move the gauges at all.
Pressing the + button an additional time brought the duty cycle up to 20.0% and the voltage up to 2.40 volts. Still, there was no gauge movement. Please see picture #4.
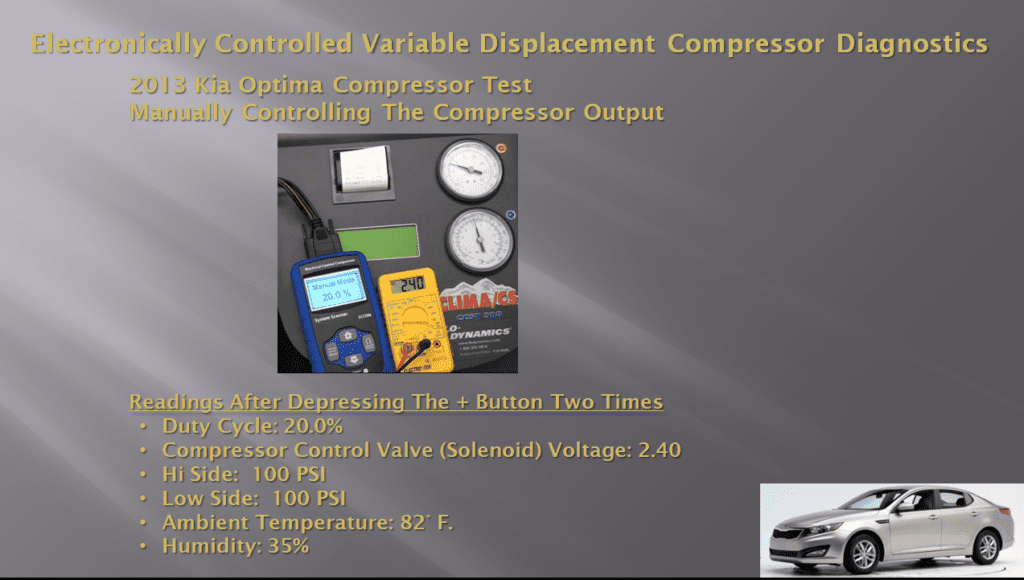
Picture #4. With the duty cycle increased to 20% and voltage at 2.40 volts there still was no gauge movement.
Pressing the + button an additional 4 times (for a total of 6 times) brought the duty cycle up to 29.0% and the voltage up to 3.73 volts. As soon as the duty cycle and voltage hit these levels there was immediate gauge movement. This was consistent with testing that we had done on other vehicles. After about 15 seconds, the high side pressure stabilized at 155 PSI and the low pressure stabilized at 55 PSI. Please see picture #5
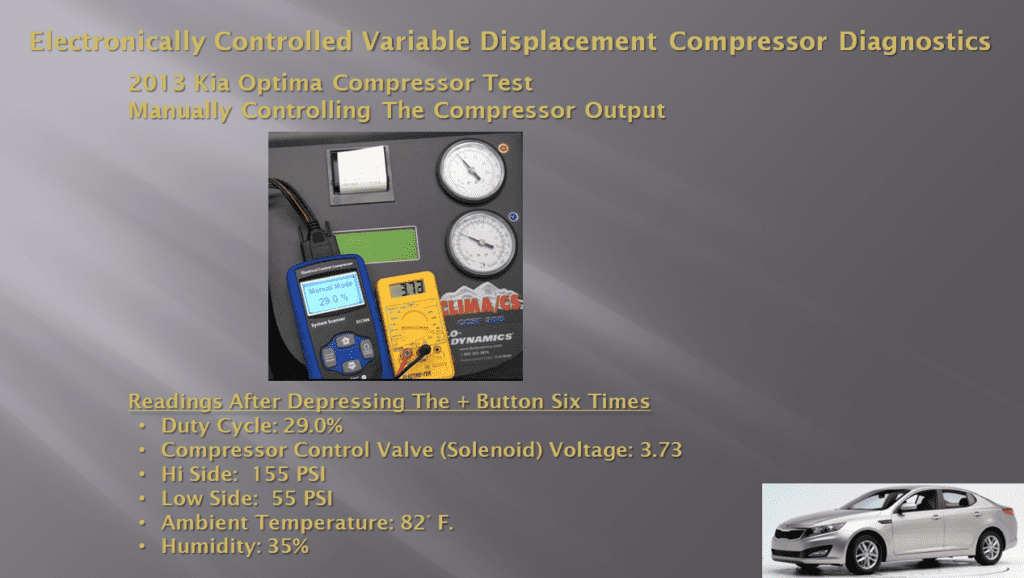
Picture #5: With the duty cycle at 29% and the voltage at 3.73 volts, the high side pressure increased to 155 PSI from a static pressure of 100 PSI and the low side dropped down to 55 PSI.
Pressing the + button an additional 11 times (for a total of 17 times) brought the duty cycle up to 53.3 % and the voltage up to 7.15 volts. As the duty cycle and voltage increased, the high side pressure went up to 175 PSI and low side went down to 45 PSI. Please see picture #6.
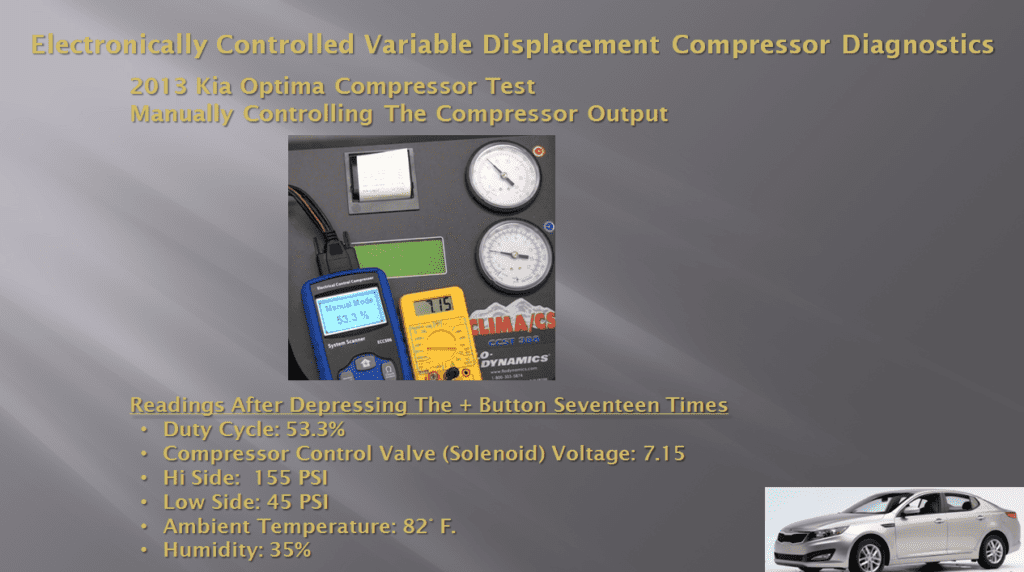
Picture #6: Increasing the duty cycle from 29.0% to 53.3% and voltage from 3.73 to 7.15 volts increased the high side pressure to 175 and brought the low side pressure down to 45 PSI.
Pressing the + button an additional 14 times for a total of 31 times brought the duty cycle up to 84.3% and the voltage up to 11.42 volts. The pressures remained the same at 175 PSI on the high side and 45 PSI on the low side. Please see picture #7.
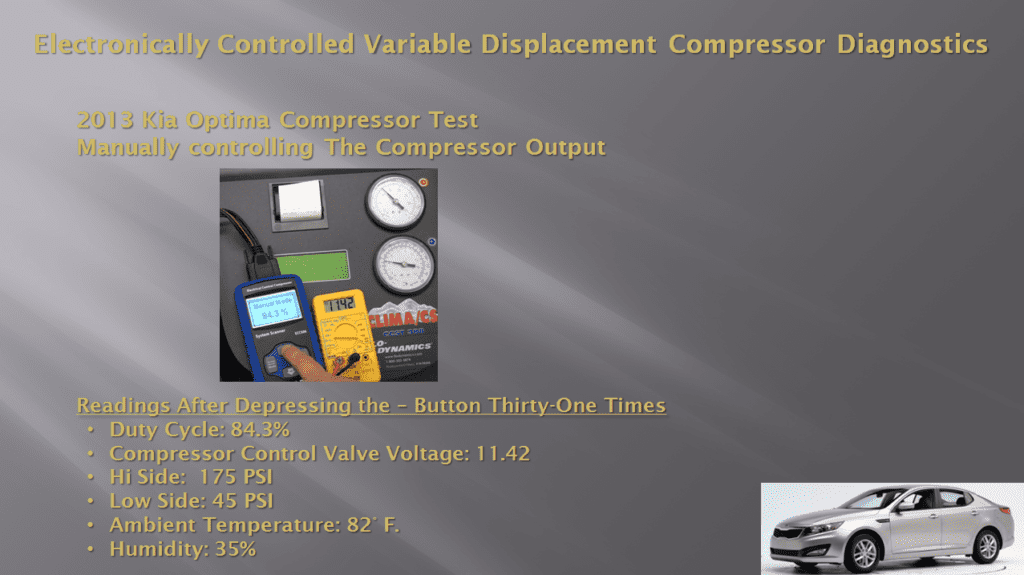
Picture #7: Surprisingly, increasing the duty cycle from 53.3% to 84.3% and voltage from 7.15 to 11.42 volts did not result in any changes in pressures.
The maximum duty cycle for this scanner is 84.3% with a voltage of 11.42 volts. The compressor was allowed to run for about 30 seconds at 84.3% and 11.42 volts and there was no change in pressures.
The next step was to start backing the duty cycle down. The pressures stayed the same until the duty cycle reached 44.3% with the voltage at 5.77 volts. At that point we detected a slight change in the tone of the engine and a slight decrease in the high side pressure from 175 PSI down to 173 PSI and a slight increase in low side pressure from 45 PSI to 47 PSI. Please see picture #8
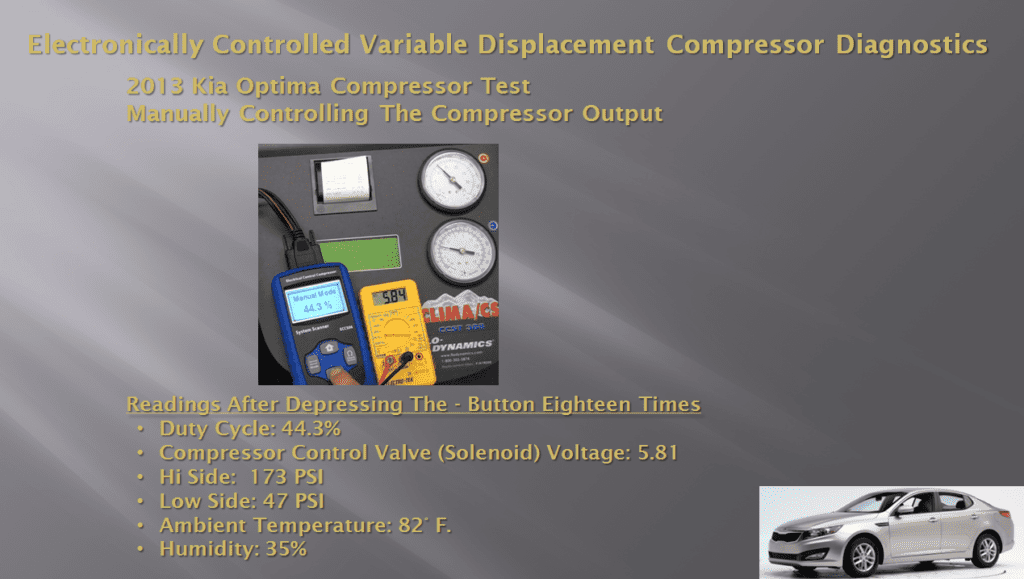
Picture #8: It took a reduction in duty cycle from 84.3% down to 44.3% before there was any change in pressures.
We continued to reduce the duty cycle, down to 29% with the voltage at 3.73 volts, which was where we had first seen the gauge movement when the test began. The high side dropped to 170 PSI and the low side increased to 50 PSI. At that point the test was concluded. Please see picture #9.
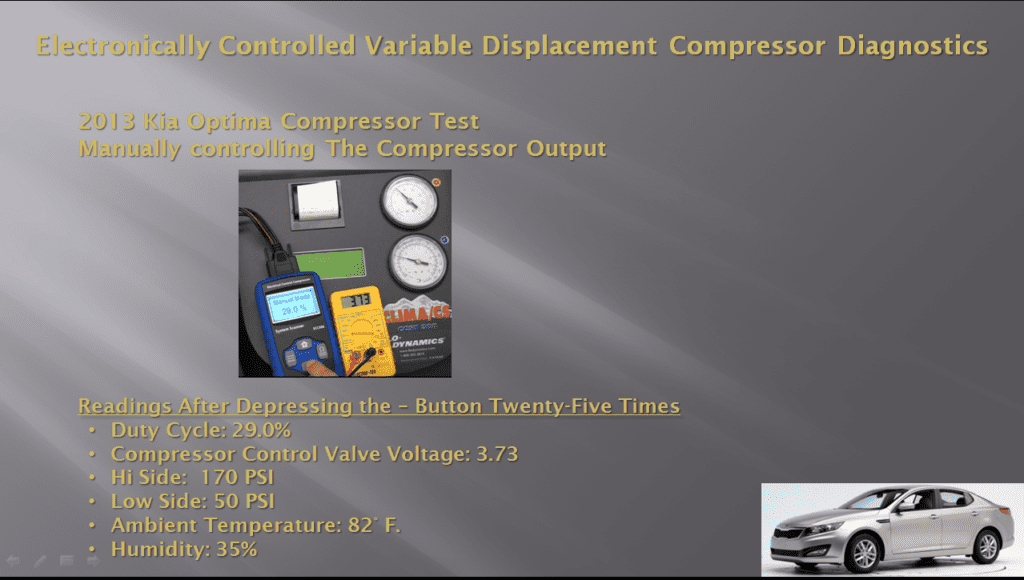
Picture #9: The final readings when the test concluded.
To summarize:
- Pressing the + button the first time produced a duty cycle of 18.0% and a voltage of 2.10 volts. It took a 29% duty cycle with the voltage at 3.73 for the gauges to move the first time. This is consistent with testing we have done on other vehicles.
- Each subsequent time the +button was pressed produced a duty cycle increase of approximately 2.0 to 2.4% and voltage increase of approximately .25 to .30 volts.
- This scanner is designed to max out with a duty cycle of 84.3% and the voltage was 11.42 volts at that level.
- Pressing the – button on the scanner to reduce the duty cycle results in approximately the same incremental duty cycle and voltage reductions as pressing the + button did increasing the duty cycle and voltage.
- System pressure changes tend to occur quicker when increasing the duty cycle and voltage compared to decreasing them.
NOTE: Behavior can vary some from system to system, but this provides a good general illustration of what can be anticipated when manually controlling an electronically controlled variabledisplacement compressor.
To view the video this information came from, you can click on the following link: https://youtu.be/t97nsbPPFqE
Use this QR code to Join MACS as a member or use this link.

Leave a Reply