Air contamination in mobile A/C systems
By Richard Hawkins, MACS contributor
Last week we outlined a test which was conducted to provide some specific information about the effects of refrigerant air contamination on A/C system pressures and temperatures. We covered a base line test conducted with 0% air contamination and provided pressure and temperature information. This week we will provide pressure and temperature information experienced with 7.7% air contamination and 18.9% air contamination. If you haven’t read last week’s article, it would be best to read it before proceeding.
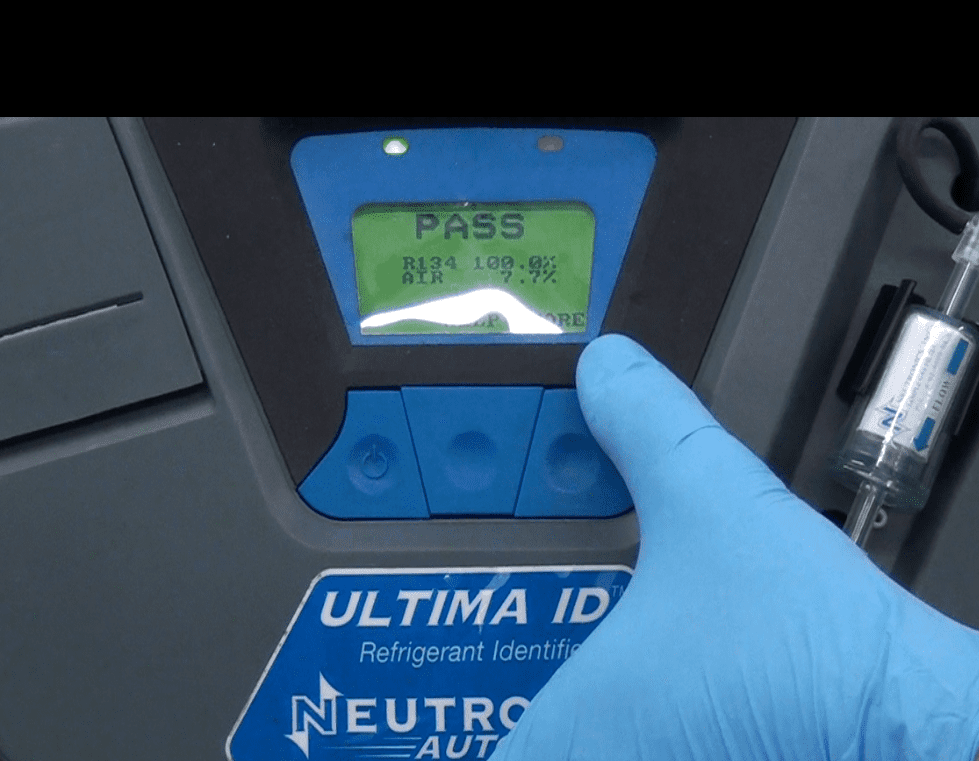
Picture #1: The refrigerant identifier indicated an air contamination level of 7.7% after intentionally introducing air into the system. NOTE: The identifier indicates “PASS” because there is no cross contamination with other refrigerants.
Test #2 with 7.7% air contamination.
Ambient temperature: Approximately 71° F (We overlooked recording the ambient temperature in test #2. All 3 of these tests were run within a time span of about 90 minutes on the same afternoon and the ambient temperature rose from 69.6 F in the first test to 72.8° F in test #3. As a result, it is reasonable to assume the ambient temperature was approximately 71° F when test #2 was conducted.)
High side pressure: 199 PSI
Low Side pressure: 31 PSI
Evaporator inlet temperature: 30.4° F
Evaporator outlet temperature: 38.4° F
Differential: 8.0° F
Condenser inlet temperature: 145.7° F
Condenser outlet temperature: 80.7° F
Differential: 65.0° F
Vent Temperature:? (Unfortunately, we overlooked recording the vent temperature during test #2. It is likely there was a slight decrease, probably down to about 48° F. That is based on the evaporator inlet temperature dropping from 37.4° F down to 30.4°F in this test (from test #1) and the evaporator outlet temperature increasing slightly from 37.4° F (in test #1) to 38.4 F in this test.
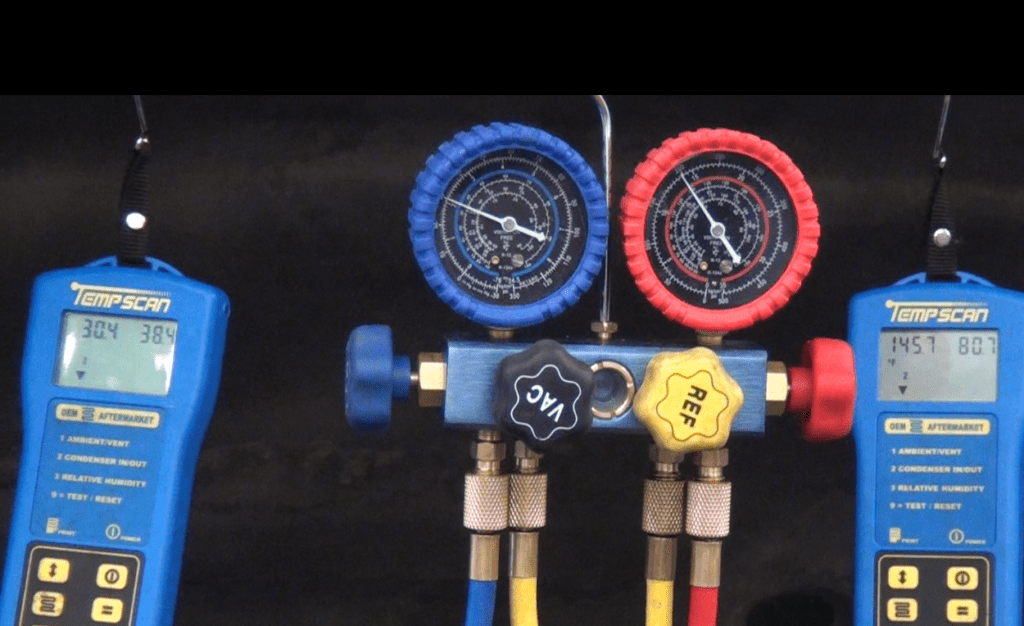
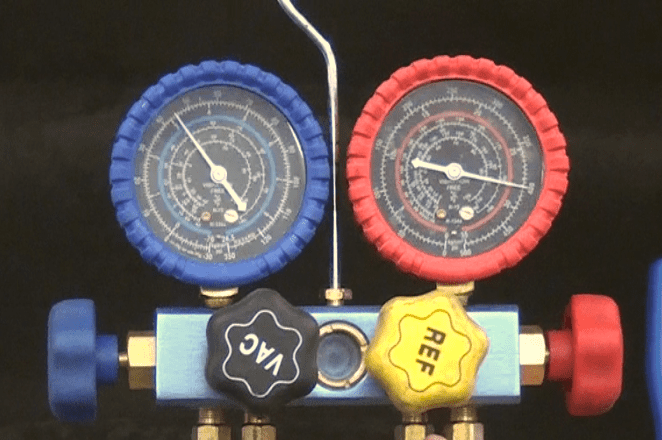
Picture #2: Here is what the readings looked like after the system stabilized in test #2.
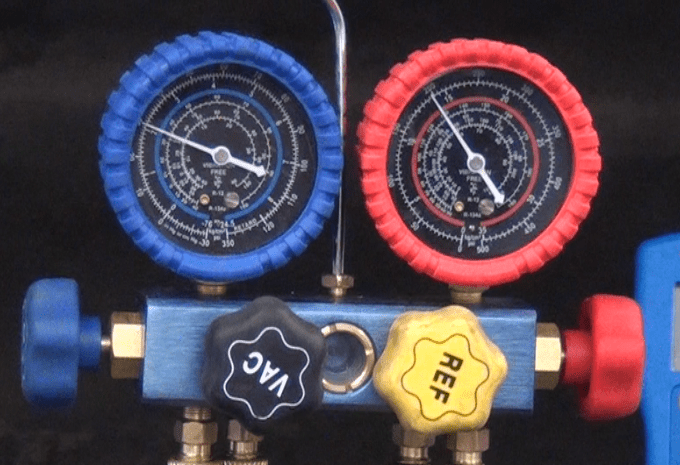
Picture #3: A close-up of the pressure readings in test #2.
A bit of a surprise in test #2 was the low side pressure dropping down to 31 PSI (from 32 PSI in test #1) and the evaporator inlet temperature dropping down to 30.4° F (from 37.4° F in test #1). With the 8.0°F evaporator inlet to outlet temperature differential, someone might incorrectly diagnose this as a low refrigerant condition without benefit of a refrigerant identifier to indicate air contamination.
The next step was to increase the air contamination and see what the effects on system pressures and temperatures were.
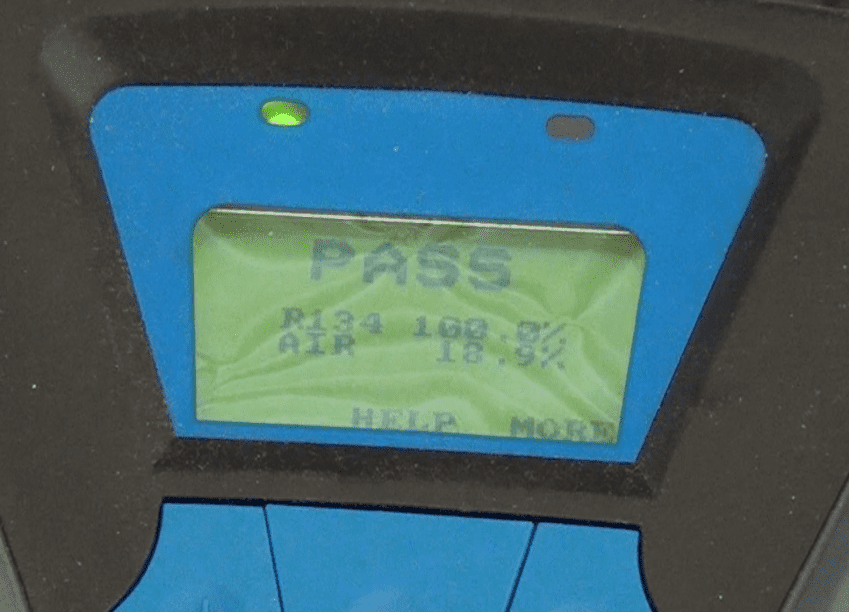
Picture #4: The refrigerant identifier indicated an air contamination level of 18.9% after intentionally introducing more air into the system. NOTE: The identifier indicates “PASS” because there is no cross contamination with other refrigerants.
Test #3 with 18.9% air contamination.
Ambient temperature: 72.8° F
High side pressure: 400 PSI
Low Side pressure: 45 PSI
Evaporator inlet temperature: 27.9° F
Evaporator outlet temperature: 39.7° F
Differential: 11.8° F
Condenser inlet temperature: 182.6° F
Condenser outlet temperature: 79.5° F
Differential: 103.1° F
Vent Temperature: 47.4° F
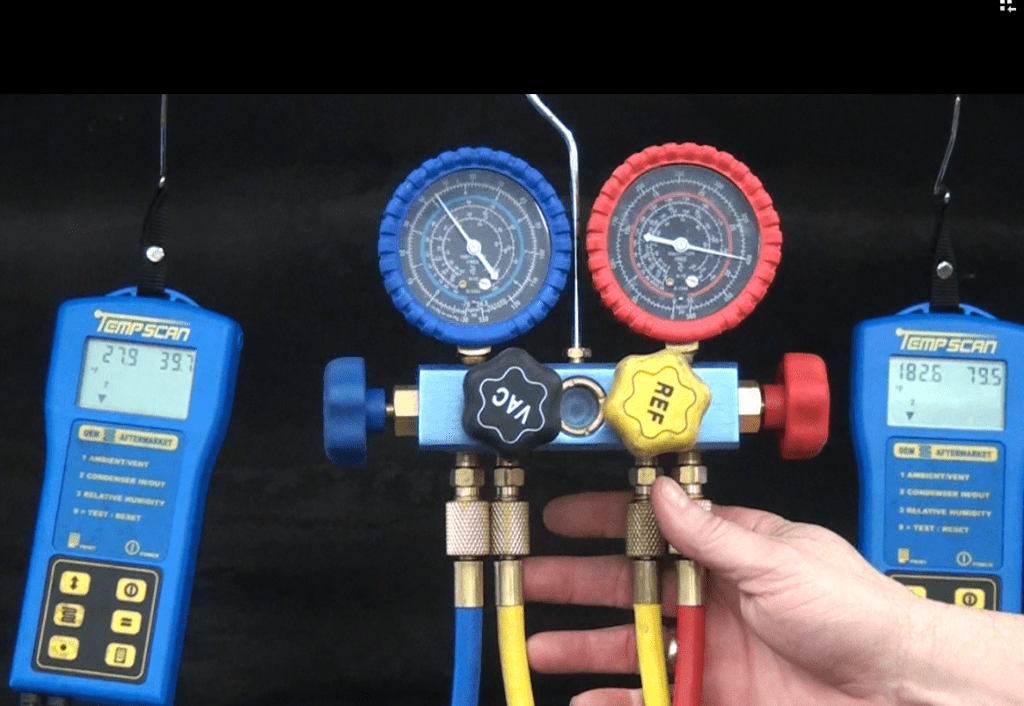
Picture #5: Here is what the readings looked like after the system stabilized in test #3.
Picture #6: A close-up of the pressure readings in test #3

Picture #7: The Tempscan on the right has been switched to read the ambient temperature on the left-hand side of the display and the vent temperature on the right hand side of the display.
A big surprise in test #3 was the evaporator inlet temperature dropping all the way down to 27.9° F (from 37.4° F in test #1 and 30.4° F in test #2). This would not be expected with the low side pressure increasing to 45 PSI (from 32 PSI in test #1 and 31 PSI in test #2.) The biggest surprise in test #3 however was the vent temperature decreasing to 47.4° F (compared to 49.1° F in test #1, which is 1.7° F lower). A decrease in vent temperature just would not be expected with an increase in high side pressure from 165 PSI (in test #1) to 400 PSI (in test #3) and an increase in low side pressure from 32 PSI (in test #1) to 45 PSI (in test #3).
If the ambient temperature had been in the 80s in test #3 the high side pressure would have been elevated enough where the high-pressure cut-out would have been turning the compressor off and on. As a result, there would have been a noticeable increase in vent temperature. Also, if the car had been driven during this test, the increased engine RPM would have increased the high side pressure enough to cause the high-pressure cut-out to turn the compressor off and on and there would have been a noticeable increase in vent temperature.
Join MACS as a member to learn more about mobile A/C training!
Leave a Reply